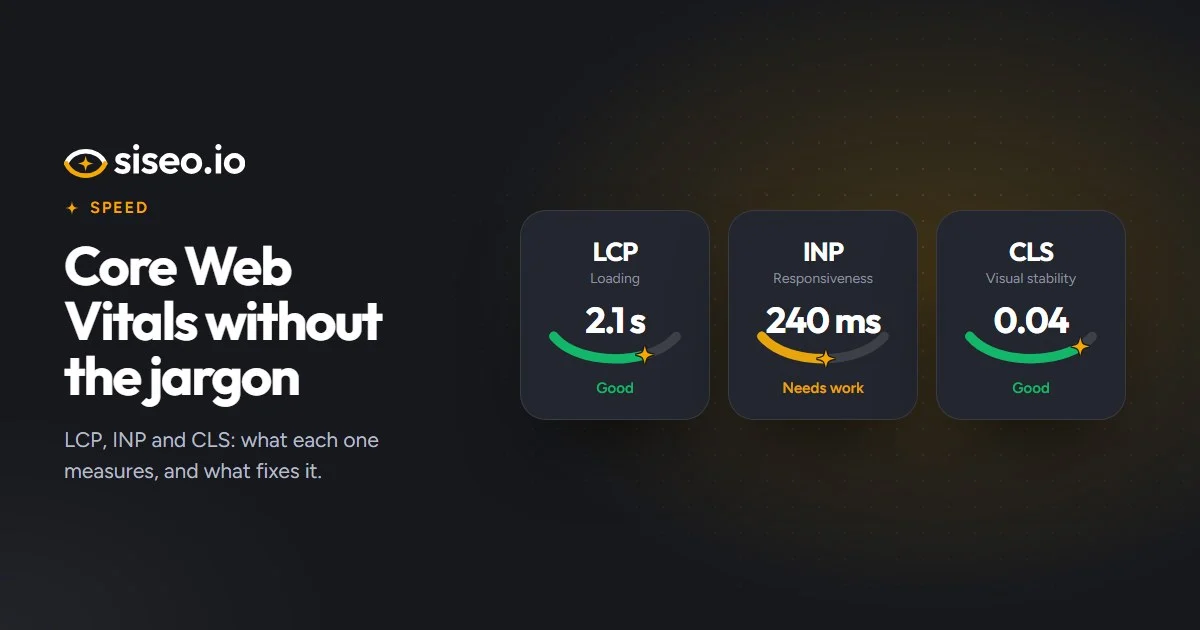
Core Web Vitals are Google’s three measures of how a page feels to the person using it: how quickly the main content appears, how quickly the page responds when you tap or click, and how much the layout jumps around while you read. Each has a short name, a number and a pass mark. This guide explains them in plain terms, along with what usually slows them down and how to fix it.
The three measures and their pass marks
Each measure has a “good” mark and a “poor” mark. Anything in between is rated “needs improvement”.
| Measure | What it measures | Good | Poor |
|---|---|---|---|
| LCP, Largest Contentful Paint | How long until the main content appears: the largest image or block of text on the first screen | 2.5 seconds or less | Over 4 seconds |
| INP, Interaction to Next Paint | How long the slowest tap, click or key press takes to show a response | 200 milliseconds or less | Over 500 milliseconds |
| CLS, Cumulative Layout Shift | How much the content moves around unexpectedly | 0.1 or less | Over 0.25 |
CLS is a score rather than a time, and lower is better. Only unexpected movement counts: shifts within half a second of a tap, click or key press are left out.
The 75th percentile: three visits in four
Google doesn’t judge a page by its best visit or its average. It takes the 75th percentile of real visits: line them up from fastest to slowest and read the value three-quarters of the way along. For LCP to be good, at least three visits in four must show the main content within 2.5 seconds. That is why a page that loads quickly on your office computer can still fail: the slowest quarter of visits, often on phones and mobile connections, decides the result.
Real visits and lab tests measure different things
There are two ways to get these numbers, and they often disagree.
Field data comes from real visits. Google gathers it from Chrome users and publishes it in the Chrome UX Report as a figure covering the last 28 days. It is what Search Console’s Core Web Vitals report and the real-user section of PageSpeed Insights show, and it is the data that decides Core Web Vitals. A busy page has figures of its own; a quieter one may only have a figure for the whole site, and a small site may have none at all.
Lab data comes from a test. Lighthouse, the engine behind PageSpeed Insights, loads the page once on a simulated mid-range phone over a slow mobile connection and times it. It helps you find causes and works on pages nobody has visited yet, but it is an estimate, and it varies from run to run: run it three times and go by the middle result.
Two gaps matter. A lab test can’t measure INP, because nobody taps anything; Lighthouse reports Total Blocking Time instead, the time the page is too busy running code to respond. It hints at INP but isn’t INP. And the lab only watches the page load, so it misses layout shifts that happen when real visitors scroll and tap.
siseo works the same way round. Its speed checks use Chrome’s real-visitor data wherever Google has enough, and falls back to the lab only when it hasn’t, marking those results as less certain. The free scan tests your homepage on mobile and desktop; the full report adds up to three more types of page, such as a product, category or article page.
FID was replaced by INP in March 2024
Older guides talk about First Input Delay. INP replaced it as a Core Web Vital in March 2024, and siseo never reports the old measure. A tool or article that still quotes it is out of date.
What slows each one down, and the usual fixes
LCP: the main content appears late
The usual causes are a slow server response, a heavy main image, an image the browser finds late (a CSS background, or one added by a slider or script), lazy loading on the main image, and scripts and stylesheets that block the first view. The “LCP breakdown” in PageSpeed Insights shows where the time goes: the server, finding the file, downloading it or displaying it.
- Turn on full-page caching, or add a CDN, so pages are served ready-made.
- Compress the main image and serve it as WebP or AVIF at the size it is shown.
- Put it in the HTML as a normal image, not lazy-loaded, with
fetchpriority="high". - Replace a slider at the top of the page with a single image.
- Defer scripts and stylesheets that block the first view, and remove plugins and widgets you don’t need.
A main image the browser can find and fetch straight away looks like this. Its width and height also reserve its space, which helps CLS:
<img src="/images/hero-1200.webp" width="1200" height="600"
     fetchpriority="high" alt="Spring collection">
INP: taps and clicks respond slowly
Slow responses come from too much JavaScript, much of it from third-party tools such as chat widgets, tag manager tags, A/B testing, reviews, pop-ups and social feeds. INP is usually worst on mid-range phones.
- Remove the third-party tools you no longer use.
- Delay the rest until the page has loaded, or until the visitor first interacts.
- Ask your developer to find the slow interactions and break up the long tasks behind them.
- Show the response first, such as opening the menu, and do slower work like analytics calls afterwards.
CLS: the page jumps around
Content moves when something arrives late and pushes it aside: images and videos without set dimensions, ads, embeds and widgets injected after load, cookie or promotion bars that push the page down, and web fonts that swap in and reflow the text.
- Give every image and video width and height attributes, or a CSS aspect ratio, so the browser reserves the space.
- Put ads, embeds and widgets in containers with a fixed minimum height.
- Show cookie and promotion bars as overlays instead of pushing content down.
- Load web fonts with
font-display: optional, or use a fallback font sized to match. - Don’t insert content above what is already on screen unless the visitor asked for it.
How much Core Web Vitals matter for search
Google says Core Web Vitals are used by its ranking systems, but relevance always comes first. So treat them mainly as a question of visitors and sales, with a modest search effect. People on phones tend to leave a page that stays blank too long, taking their order or enquiry with them, and content that jumps causes mis-taps and accidental clicks.
Time to first byte, how long your server takes to start answering, isn’t a Core Web Vital, but it is the floor under LCP: nothing can appear before it. web.dev counts 0.8 seconds or less as good and over 1.8 seconds as poor.
How to check your own pages
Paste a page address into PageSpeed Insights to see the real-visitor figures, where Google has them, and a lab test with its diagnosis. Search Console’s Core Web Vitals report tracks the real-visitor figures over time. After a fix, give it time: the field data covers the last 28 days of visits, so it takes up to 28 days to show the full effect. web.dev’s guides to LCP, INP and CLS go into more depth.
In short: judge your pages by real-visitor data at the 75th percentile, use lab tests to find the causes, and start with the main image, third-party scripts and space reserved for anything that loads late.